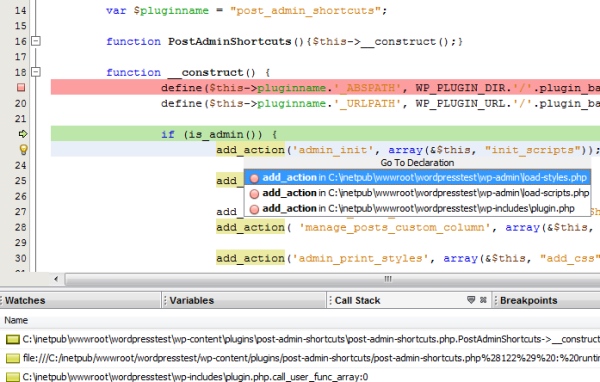
How do you debug issues in your WordPress themes or plugins? Up until recently I have been doing it the wrong way : inserting echo and print_r statements into the source. There are obviously a few issues with this. The main one being that you have the chance of releasing code to the world with crappy debugging variable dumps (this has happened quite a few times in the past with plugins that I have released). So I decided to make a change.
Visual Studio Quality Debugging
I come from a Microsoft Visual Studio background, and I must say I was a bit spoilt when it comes to debugging. VS comes standard with the ability to step into code and look (and change) variable values in realtime. I love the fact that I can set a breakpoint, run the project and go directly where I want to go with minimal effort. My goal was to find the same debugging awesomeness with WordPress. And I have succeeded!
- The first step was to find a capable IDE. And the easy answer is NetBeans PHP IDE. The current version out is 6.9. Download and install it. You won’t be sorry when you switch from Notepad++, or whatever other smart text editor you are currently using. NetBeans has a powerful PHP source code editor, built-in intelli-sense, PHP unit-testing, MySQL integration and much more.
-
You then need to install and configure XDebug on your development machine. XDebug allows you to debug your PHP scripts properly. Goto the Tailored Installation Instruction page to test your local PHP configuration to see which binary to download and install. You will need to paste the HTML output from phpinfo() and paste it into the textbox provided. Submit it and it will give you a download link and instructions to follow.
-
Aswell as adding a path to the XDebug binary included in their istructions, you also need to add the following lines to your php.ini file:
                                                xdebug.remote_enable=On

                                                xdebug.remote_host="localhost"

                                                xdebug.remote_port=9000

                                                xdebug.remote_handler="dbgp"
-
I came across a slight issue when following the provided XDebug instructions. I was asked to add the line zend_extension = C:\Program Files (x86)\PHP\ext\php_xdebug-2.1.0-5.2-vc6-nts.dll to my php.ini file. It did’nt actually work until I surrounded the path with quotation marks e.g. zend_extension = “C:\Program Files (x86)\PHP\ext\php_xdebug-2.1.0-5.2-vc6-nts.dll
“
-
Aswell as adding a path to the XDebug binary included in their istructions, you also need to add the following lines to your php.ini file:
- Restart your local web server.
- Look at your phpinfo() output again to ensure you now have XDebug enabled.
- Fire up NetBeans. Create a new project and point it to your WordPress folder.
- Open a PHP script file that you know will be included i.e. your plugin that is activated in the WordPress backend. Add a breakpoint on a line by clicking the line number in the margin.
- Click the “Debug Project” button or Ctrl+F5. If all went well, it should open the site in a browser and immediately break into WordPress’s index.php file.
- Hit F5 to continue and it should break on your breakpoint you set earlier.

Mission Accomplished
Now you can:
- step through the code one line at a time to see where and how your code logic is working
- check variable values
- check the Call Stack to see how you got to your current code position
That is just what I was after, so mission accomplished. Now there are no excuses to not test your code before releasing it, and there is absolutely no excuse to include echo or print_r statements in your code again!